July 17, 2026 · Bizware
Cost for Facebook Ads: 2026 Pricing Guide for Businesses
Discover the cost for Facebook ads in 2026. Get average CPC, CPM, and CPA benchmarks, plus strategies to optimize your ad budget effectively.
Understanding the cost for Facebook ads remains a critical priority for businesses investing in digital marketing strategies. With over 3 billion active users worldwide, Facebook continues to offer unparalleled reach for companies targeting diverse audiences. However, the complexity of Facebook's auction-based pricing model means costs can vary dramatically based on numerous factors including industry competition, audience targeting, ad quality, and campaign objectives. For businesses leveraging custom AI solutions to enhance their sales and marketing efforts, knowing exactly what to budget for Facebook advertising campaigns ensures better resource allocation and more predictable ROI outcomes.
Understanding Facebook Ad Pricing Fundamentals
The cost for Facebook ads operates on an auction system where advertisers bid for ad placements across Facebook, Instagram, Messenger, and the Audience Network. Unlike traditional advertising models with fixed pricing, Facebook employs a dynamic pricing structure that responds to real-time demand and competition.
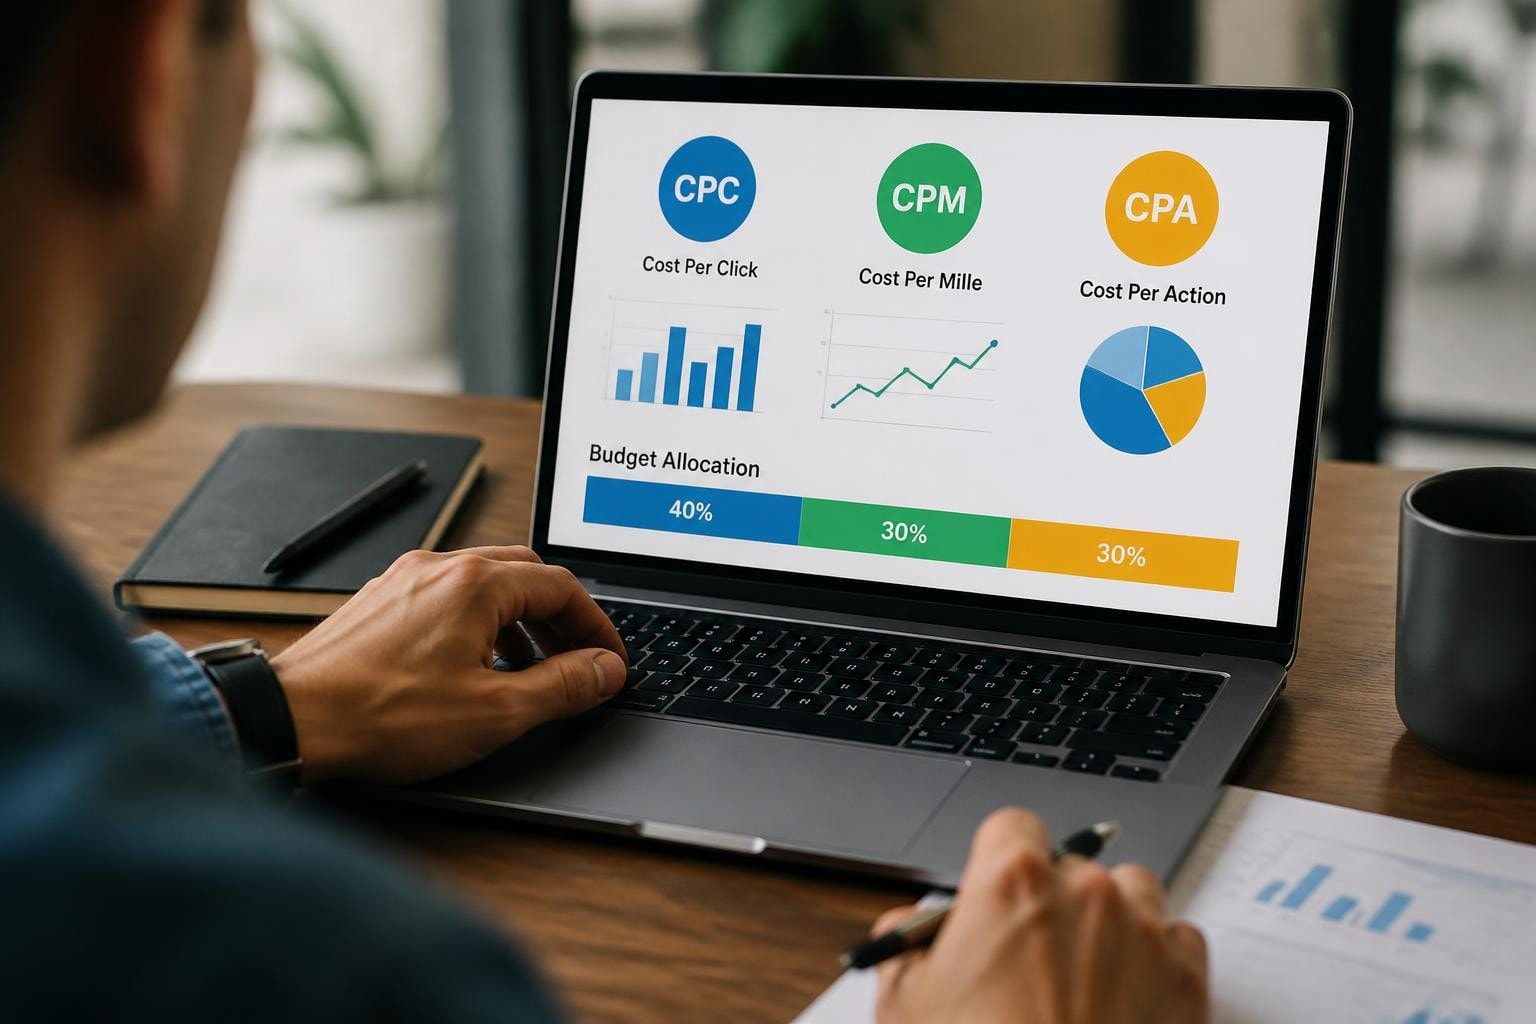
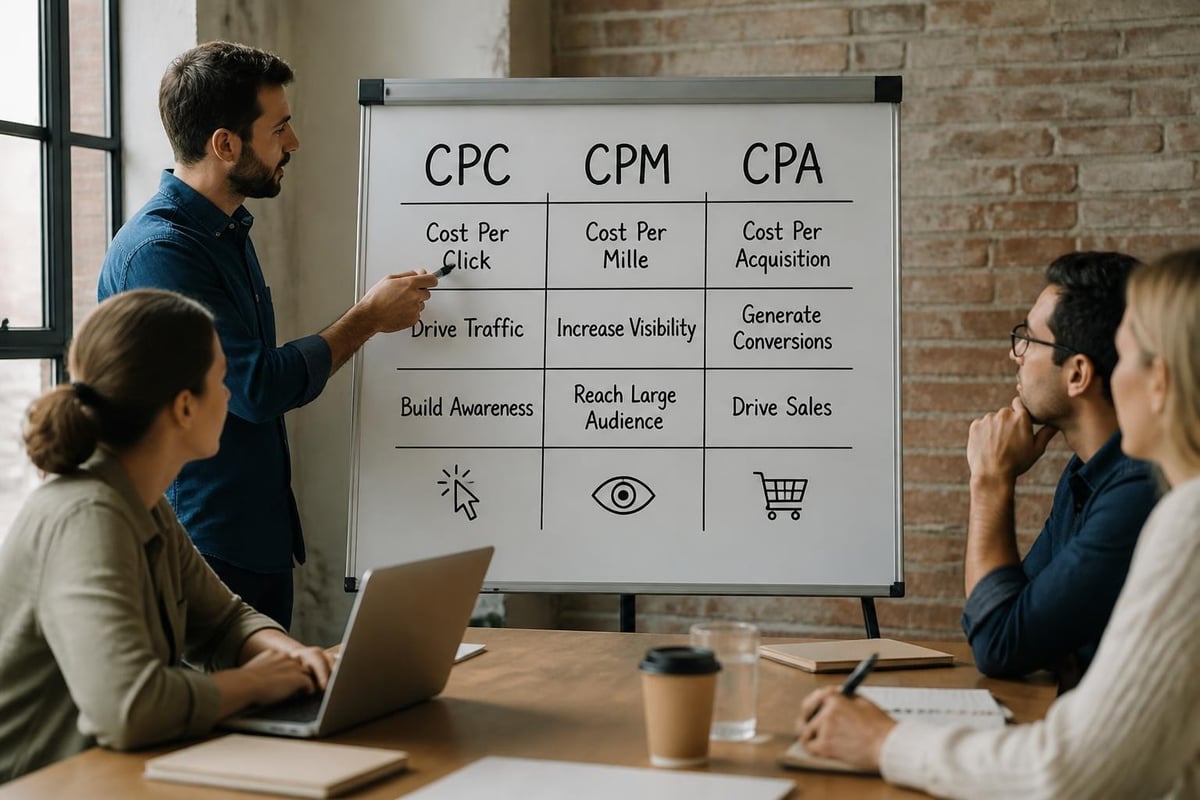
Facebook charges advertisers based on several pricing models that align with campaign objectives. The three primary cost metrics include cost per click (CPC), cost per thousand impressions (CPM), and cost per action (CPA). Each metric serves different campaign goals and provides distinct value depending on your marketing strategy.
Primary Cost Metrics Explained
Cost per click (CPC) measures what you pay each time someone clicks on your advertisement. This model works best for campaigns focused on driving traffic to websites, landing pages, or specific product pages. According to comprehensive Facebook ad cost data, the average CPC ranges from $0.50 to $2.00 across industries in 2026.
Cost per thousand impressions (CPM) calculates your cost for every 1,000 times your ad appears on someone's screen, regardless of whether they interact with it. This pricing model benefits brand awareness campaigns where visibility matters more than immediate conversions.
Cost per action (CPA) represents what you pay when users complete specific actions like form submissions, purchases, or app installations. This performance-based pricing typically costs more per conversion but ensures you only pay for completed objectives.
| Metric | Average Cost 2026 | Best For | Payment Trigger |
|---|---|---|---|
| CPC | $0.50 - $2.00 | Website traffic, engagement | User clicks ad |
| CPM | $5.00 - $15.00 | Brand awareness, reach | 1,000 impressions |
| CPA | $10.00 - $50.00 | Conversions, leads | Completed action |
Key Factors That Influence Facebook Ad Costs
Multiple variables impact the final cost for Facebook ads, and understanding these factors enables advertisers to optimize their spending efficiently. The Facebook algorithm evaluates each ad based on relevance, quality, and estimated action rates to determine placement and pricing.
Audience targeting specificity directly correlates with ad costs. Narrowly defined audiences in competitive niches typically command higher prices because multiple advertisers compete for the same users. Conversely, broader audiences may cost less per impression but could deliver lower conversion rates.
Ad relevance and quality scores significantly affect your costs. Facebook assigns relevance scores based on how well your ad resonates with your target audience. Higher scores result in lower costs and better placements, while poor-performing ads face increased prices and reduced visibility.
Industry-Specific Cost Variations
Different industries experience vastly different costs for Facebook advertising campaigns. According to detailed industry benchmarks, highly competitive sectors like finance, insurance, and legal services often pay premium rates, while retail and e-commerce typically see more moderate costs.
- Finance and Insurance: $3.77 average CPC, $15.50 average CPM
- Technology and Software: $2.50 average CPC, $12.00 average CPM
- Retail and E-commerce: $0.70 average CPC, $6.50 average CPM
- Professional Services: $2.15 average CPC, $10.25 average CPM
- Healthcare: $1.85 average CPC, $8.75 average CPM
Businesses utilizing AI-powered marketing solutions can leverage machine learning algorithms to identify optimal audience segments and reduce costs through improved targeting precision.
Seasonal Trends and Timing Impact
The cost for Facebook ads fluctuates throughout the year based on advertiser demand and seasonal shopping patterns. Understanding these cycles helps businesses budget appropriately and capitalize on lower-cost periods.
Q4 holiday season traditionally represents the most expensive period for Facebook advertising, with costs increasing 30-50% during November and December. Retailers compete aggressively for consumer attention during Black Friday, Cyber Monday, and the Christmas shopping season.
January and February typically offer the lowest costs as advertising demand decreases post-holidays. Savvy advertisers can secure better placements at reduced rates during these months, making it an ideal time for testing new campaigns and building audience engagement.
Day and Time Considerations
Ad costs also vary by day of week and time of day. Weekday business hours typically command higher prices in B2B sectors, while B2C advertisers often see increased competition during evenings and weekends when consumer browsing peaks.
| Time Period | Cost Impact | Best For |
|---|---|---|
| Monday-Friday 9AM-5PM | +15-25% | B2B campaigns |
| Weekday evenings | +10-20% | Consumer products |
| Weekends | +5-15% | Retail, entertainment |
| Late night/early morning | -20-30% | Budget-conscious campaigns |
Companies can integrate these timing strategies into their sales AI systems to automatically adjust bidding based on performance patterns and cost efficiency windows.
Budget Planning Strategies for Different Business Stages
Setting appropriate budgets for Facebook advertising depends on business size, growth stage, and marketing objectives. The cost for Facebook ads should align with overall revenue goals and customer acquisition targets.
Startup businesses with limited budgets should begin with $500-$1,500 monthly allocations focused on testing audiences and creative formats. This investment level allows for meaningful data collection while minimizing financial risk during the learning phase.
Growing businesses typically allocate $2,500-$10,000 monthly as they scale successful campaigns and expand into new audience segments. At this stage, consistent optimization and A/B testing become critical for maintaining cost efficiency.
Established enterprises often invest $15,000-$100,000+ monthly across multiple campaigns, products, and customer journey stages. These organizations leverage sophisticated attribution models and customer lifetime value calculations to justify higher advertising expenditures.
Calculating Your Minimum Viable Budget
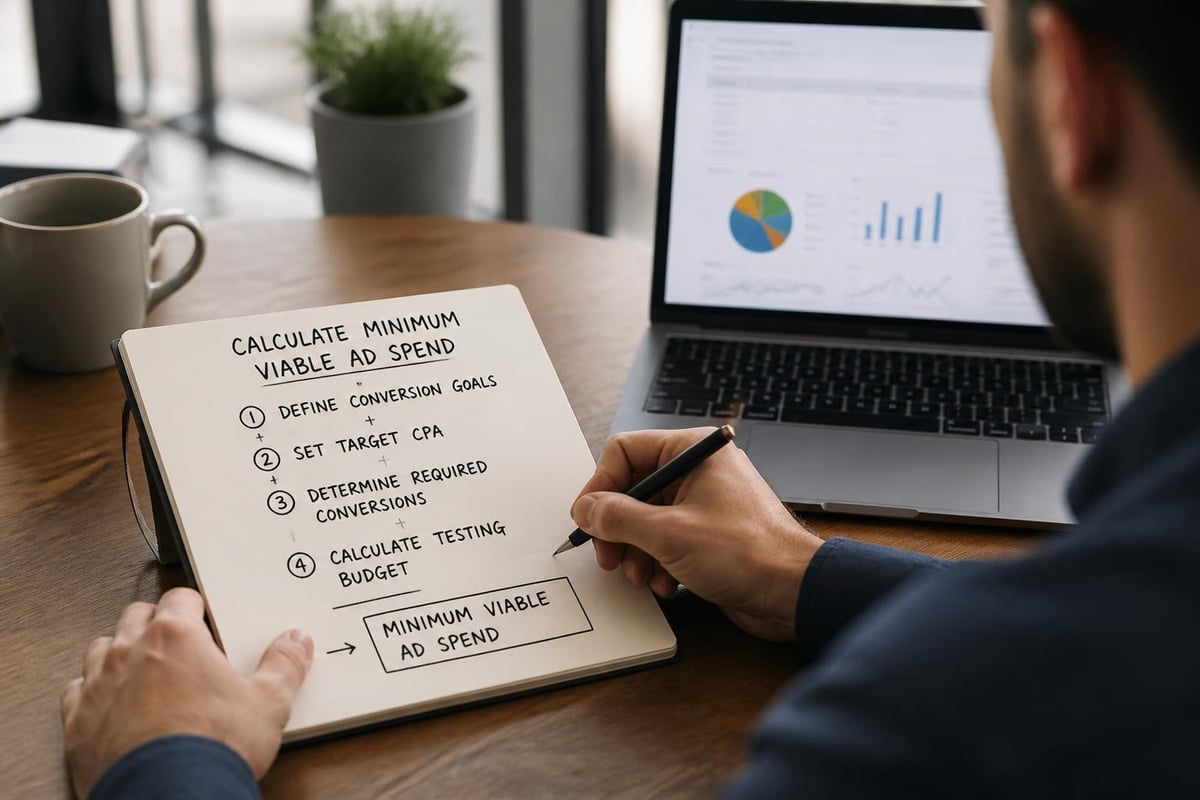
To determine your minimum Facebook ad budget, consider these calculations:
- Identify your cost per acquisition target: Calculate how much you can afford to pay for each customer
- Estimate conversion rates: Industry averages range from 2-10% depending on offer quality
- Calculate required traffic: Divide desired conversions by conversion rate
- Multiply by estimated CPC: Use industry benchmarks as starting points
- Add 20-30% buffer: Account for testing and optimization needs
Research from Facebook advertising cost analysis suggests that businesses should plan for at least 50 conversions per month to gather statistically significant data for optimization decisions.
Campaign Objective Impact on Costs
Facebook offers multiple campaign objectives, and each one influences the cost for Facebook ads differently. The platform optimizes delivery based on your selected objective, which affects both pricing and performance outcomes.
Awareness objectives including brand awareness and reach typically utilize CPM pricing and cost less overall but don't optimize for specific actions. These campaigns work well for introducing new products or building initial market presence.
Consideration objectives such as traffic, engagement, video views, and lead generation balance cost and performance. These mid-funnel campaigns typically show moderate costs while building audience interest and collecting prospect information.
Conversion objectives including catalog sales, store visits, and website conversions optimize for specific actions and often carry the highest costs per result. However, these campaigns deliver the most business-relevant outcomes and strongest ROI potential.
Objective-Based Cost Expectations
Different campaign objectives produce varying cost structures based on optimization goals and user behavior requirements:
- Brand Awareness: $5-$12 CPM, no CPC/CPA data
- Traffic: $0.40-$1.75 CPC, depends on destination
- Engagement: $0.05-$0.30 per engagement
- Video Views: $0.01-$0.05 per view (3+ seconds)
- Lead Generation: $5-$25 per lead
- Conversions: $15-$75 per conversion
Businesses implementing qualified lead generation strategies should prioritize conversion-focused objectives once initial audience testing establishes viable targeting parameters.
Placement Strategy and Cost Efficiency
Facebook's advertising network extends across multiple placements including Facebook News Feed, Instagram Stories, Messenger inbox, and Audience Network. Each placement commands different costs and delivers varying performance levels.
Facebook News Feed placements typically cost 10-20% more than other options but deliver superior engagement rates and conversion performance. This premium placement justifies higher costs through better user attention and interaction quality.
Instagram Feed and Stories have grown increasingly competitive, with costs approaching parity with Facebook News Feed. However, Instagram often delivers stronger performance for visual products and younger demographic targets.
Messenger and Audience Network placements offer reduced costs, sometimes 30-50% lower than premium placements. While these options stretch budgets further, they may produce lower-quality engagement depending on campaign objectives.
Placement Performance Comparison
| Placement | Cost Relative to Facebook Feed | Best Use Cases | Engagement Quality |
|---|---|---|---|
| Facebook News Feed | Baseline (100%) | Most campaigns | Highest |
| Instagram Feed | 95-110% | Visual products, lifestyle | High |
| Instagram Stories | 85-100% | Mobile-first, video content | Medium-High |
| Facebook Right Column | 40-60% | Retargeting, awareness | Medium |
| Audience Network | 30-50% | Budget stretching | Variable |
| Messenger | 60-80% | Customer service, engagement | Medium |
Testing various placements through automatic placement optimization helps identify the most cost-effective channels for your specific audience and objectives while maintaining performance standards.
Bidding Strategies That Control Costs
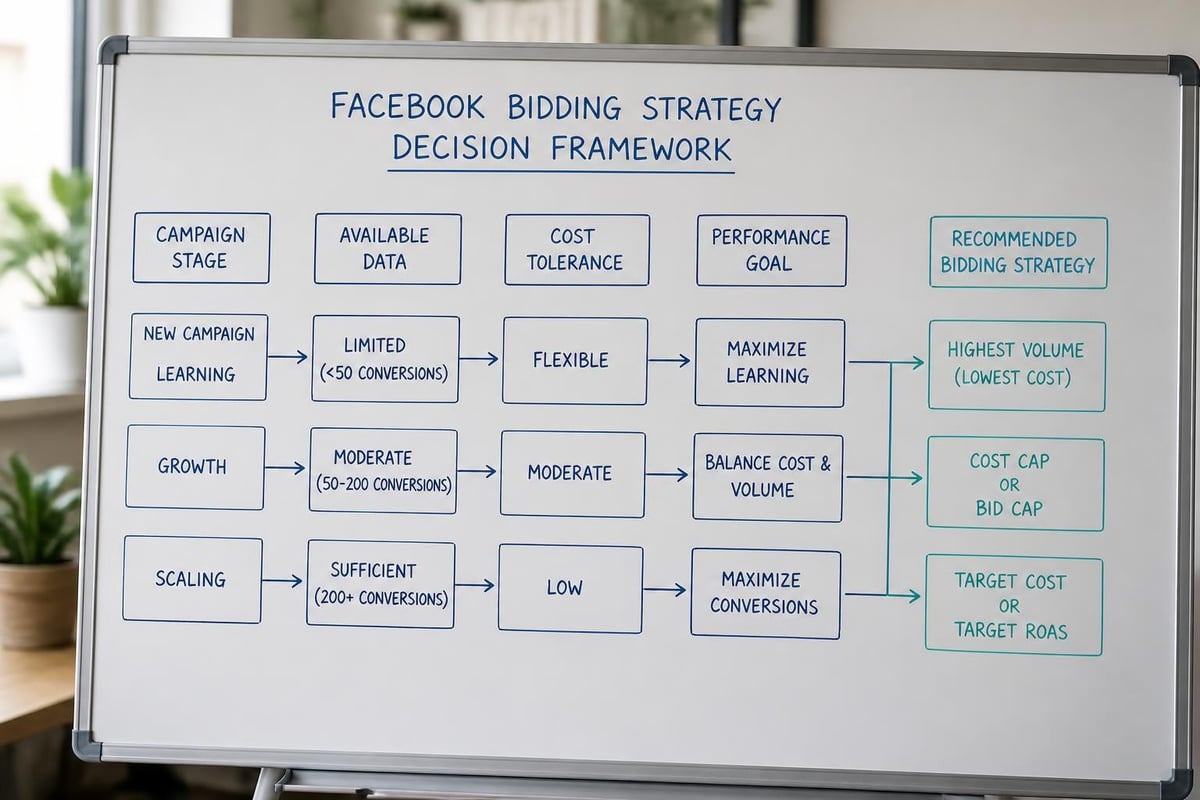
Facebook offers several bidding strategies that directly impact the cost for Facebook ads and campaign performance. Selecting the appropriate strategy requires understanding your cost tolerance, conversion data availability, and campaign maturity.
Lowest cost bidding allows Facebook to spend your budget pursuing the maximum number of results at any cost. This strategy works well for new campaigns without historical data but can produce unpredictable costs as Facebook prioritizes volume over efficiency.
Cost cap bidding sets a maximum average cost per result across your campaign, giving Facebook flexibility to bid higher or lower while maintaining your target average. This balanced approach provides cost control without sacrificing too much volume.
Bid cap bidding establishes a strict maximum bid for each auction, ensuring you never pay more than your specified amount. While this strategy offers maximum cost control, it may significantly limit delivery volume and reach.
Advanced Bidding Techniques
Sophisticated advertisers leverage bidding strategies based on campaign performance data and business economics:
- Start with lowest cost during initial testing phases (first 7-14 days)
- Transition to cost cap once you establish baseline performance metrics
- Implement bid caps for mature campaigns with consistent conversion data
- Adjust caps based on customer lifetime value rather than immediate ROAS
- Test different bid strategies across similar ad sets for comparison
According to Facebook advertising pricing research, advertisers using strategic bid management reduce their average costs by 25-40% compared to those relying solely on automatic bidding.
Creative Quality and Cost Relationship
Ad creative quality significantly influences the cost for Facebook ads through relevance scores and user engagement rates. Higher quality advertisements earn better placement at lower costs, while poor creative drives up expenses through reduced performance.
Relevance diagnostics provide three metrics that reveal creative effectiveness: quality ranking, engagement rate ranking, and conversion rate ranking. Ads scoring in the bottom 35% of competitors face inflated costs and reduced delivery.
Visual elements including images, videos, and design layouts directly impact user stopping power and interaction rates. Compelling visuals generate higher click-through rates, which signal quality to Facebook's algorithm and reduce costs.
Creative Optimization Tactics
Implement these creative strategies to improve quality scores and reduce costs:
- Test multiple creative variations simultaneously to identify top performers
- Refresh creative every 2-3 weeks to combat ad fatigue
- Use clear, benefit-focused messaging that resonates with audience pain points
- Incorporate social proof through testimonials, reviews, or user-generated content
- Optimize for mobile viewing since 94% of Facebook ad revenue comes from mobile
- Include strong calls-to-action that guide users toward desired behaviors
Businesses leveraging AI implementation services can utilize machine learning to analyze creative performance patterns and generate data-driven recommendations for improving ad effectiveness while reducing costs.
Audience Targeting Precision and Cost Trade-offs
The relationship between audience targeting specificity and the cost for Facebook ads presents a critical balance between reach and efficiency. Narrower audiences typically cost more per impression but often deliver superior conversion rates and lower cost per acquisition.
Broad targeting with minimal demographic and interest filters produces lower CPMs but may include many irrelevant users who won't convert. This approach works for top-of-funnel awareness campaigns or businesses with universal appeal products.
Layered targeting combining multiple demographic, interest, and behavior criteria increases precision and relevance at the expense of higher costs. Mid-funnel campaigns benefit from this balanced approach that filters out unlikely converters while maintaining reasonable reach.
Lookalike audiences based on existing customer data often provide the sweet spot of targeting efficiency. These audiences typically cost 10-30% less than cold interest-based targeting while delivering conversion rates 2-3 times higher.
Custom Audience Cost Advantages
| Audience Type | Relative Cost | Conversion Efficiency | Best Applications |
|---|---|---|---|
| Broad Interest | Lowest (-30%) | Low baseline | Awareness, testing |
| Detailed Targeting | Moderate | Medium | Consideration |
| Lookalike 1-3% | Moderate (+10%) | High | Acquisition |
| Custom Audiences | Higher (+20%) | Very High | Retargeting |
| Website Visitors | Highest (+40%) | Highest | Conversions |
Testing and Optimization for Cost Reduction
Systematic testing represents the most reliable method for reducing the cost for Facebook ads over time. Strategic experimentation identifies winning combinations of audiences, creative, placements, and messaging that maximize efficiency.
A/B testing frameworks should isolate individual variables to produce clear insights. Test one element at a time such as headline variations, image options, or audience segments while keeping all other factors constant.
Statistical significance requires adequate sample sizes before making optimization decisions. Plan for minimum thresholds of 100 clicks or 1,000 impressions per variant before declaring winners, depending on your conversion volumes.
Structured Testing Roadmap
Follow this sequence for systematic cost optimization:
- Week 1-2: Test 3-5 different audience segments with identical creative
- Week 3-4: Test 3-5 creative variations with winning audience
- Week 5-6: Test different placements with winning audience-creative combination
- Week 7-8: Test bid strategies and budget allocations
- Ongoing: Continuous incremental improvements and seasonal adjustments
Data from Facebook ad cost optimization studies shows that systematic testing programs reduce average costs by 35-60% within 90 days while simultaneously improving conversion rates by 20-40%.
Platform Algorithm Changes and Cost Implications
Facebook regularly updates its advertising algorithm, auction mechanics, and policy requirements, which can significantly impact the cost for Facebook ads. Staying informed about platform changes helps advertisers adapt strategies proactively rather than reactively.
iOS 14.5 privacy updates in recent years reduced targeting precision and tracking capabilities, forcing advertisers to adapt with broader audiences and improved creative. These changes initially increased costs by 15-25% for many advertisers before optimization efforts compensated.
AI-powered optimization features introduced by Facebook include Advantage+ campaigns that leverage machine learning for automated audience expansion and creative optimization. Early adopters report mixed results with some seeing 20-30% cost reductions while others experience increased volatility.
Policy enforcement around ad content, targeting restrictions, and business verification requirements can suddenly impact campaign performance and costs. Regular policy reviews and compliance monitoring prevent unexpected account restrictions that disrupt campaign delivery.
Businesses should monitor Facebook's official business resources and industry publications monthly to stay ahead of algorithmic changes. Implementing custom AI solutions for sales and marketing provides adaptive systems that automatically adjust to platform changes without manual intervention.
Industry Benchmark Analysis for 2026
Understanding industry-specific benchmarks for the cost for Facebook ads enables realistic budget planning and performance evaluation. While your results will vary based on countless factors, these benchmarks provide directional guidance for expectations.
According to comprehensive industry cost analysis, average Facebook advertising costs across industries show significant variation based on competitive intensity and customer value:
B2B service industries including software, consulting, and professional services typically see higher costs ranging from $2.50-$5.00 CPC due to longer sales cycles and higher customer lifetime values. These businesses can justify premium advertising costs through substantial contract values.
E-commerce and retail sectors benefit from faster purchase decisions and lower consideration requirements, resulting in moderate costs between $0.60-$1.50 CPC. Volume-based strategies work well in these categories where customer acquisition costs must remain low.
Local service businesses such as restaurants, salons, and home services often achieve the lowest costs at $0.40-$1.00 CPC due to less competitive local targeting parameters and straightforward conversion paths.
Geographic Cost Variations
Location targeting also significantly affects advertising costs, with developed markets commanding premium prices:
- United States: Highest costs, 100% baseline
- Canada, UK, Australia: 85-95% of US costs
- Western Europe: 70-85% of US costs
- Eastern Europe, Latin America: 40-60% of US costs
- Asia (excluding Japan): 30-50% of US costs
For businesses exploring pay-per-click marketing strategies across multiple platforms, Facebook often provides superior targeting capabilities and lower costs compared to Google Ads for awareness and consideration campaigns, though conversion intent may be lower.
Attribution and True Cost Measurement
Accurately measuring the cost for Facebook ads requires sophisticated attribution models that account for multi-touch customer journeys. Relying solely on Facebook's last-click attribution often undervalues the platform's contribution to conversions influenced by multiple touchpoints.
Multi-touch attribution distributes conversion credit across all marketing interactions a customer experiences before purchasing. This approach reveals Facebook's role in assisted conversions that might otherwise be attributed entirely to bottom-funnel channels like search ads.
Customer lifetime value calculations provide critical context for evaluating acceptable acquisition costs. A customer worth $5,000 over three years justifies much higher initial acquisition costs than one worth $50 in a single transaction.
Comprehensive Cost Analysis Framework
Evaluate Facebook advertising effectiveness using these expanded metrics beyond surface-level costs:
- Customer acquisition cost (CAC): Total ad spend divided by new customers acquired
- CAC to LTV ratio: Customer lifetime value should exceed CAC by 3:1 minimum
- Return on ad spend (ROAS): Revenue generated divided by ad spend
- Contribution margin per customer: Profit after variable costs, not just revenue
- Payback period: Time required to recover acquisition costs through customer revenue
Advanced businesses integrate Facebook advertising data with CRM systems and analytics platforms to track full customer journeys. Those implementing B2B email marketing automation alongside Facebook campaigns achieve more comprehensive attribution through coordinated multi-channel tracking.
Understanding and managing the cost for Facebook ads requires ongoing attention to platform changes, systematic testing, and strategic optimization across targeting, creative, and bidding dimensions. The investment in Facebook advertising delivers substantial returns when approached with data-driven decision making and realistic performance expectations. For businesses seeking to leverage advanced technology for optimizing their advertising investments, Ryan Cook provides custom AI solutions and sales AI systems that automate campaign optimization, improve targeting precision, and maximize marketing ROI through intelligent data analysis and predictive modeling.